StratHall
StratHall is a next-generation, full-stack financial strategy platform built to eliminate market guesswork for retail investors. The platform replaces traditional, hype-driven financial newsletters with transparent, rule-based trading strategies. It allows users to browse verified strategies, track real-time performance against the S&P 500, run historical simulations, and receive precise entry/exit alerts.

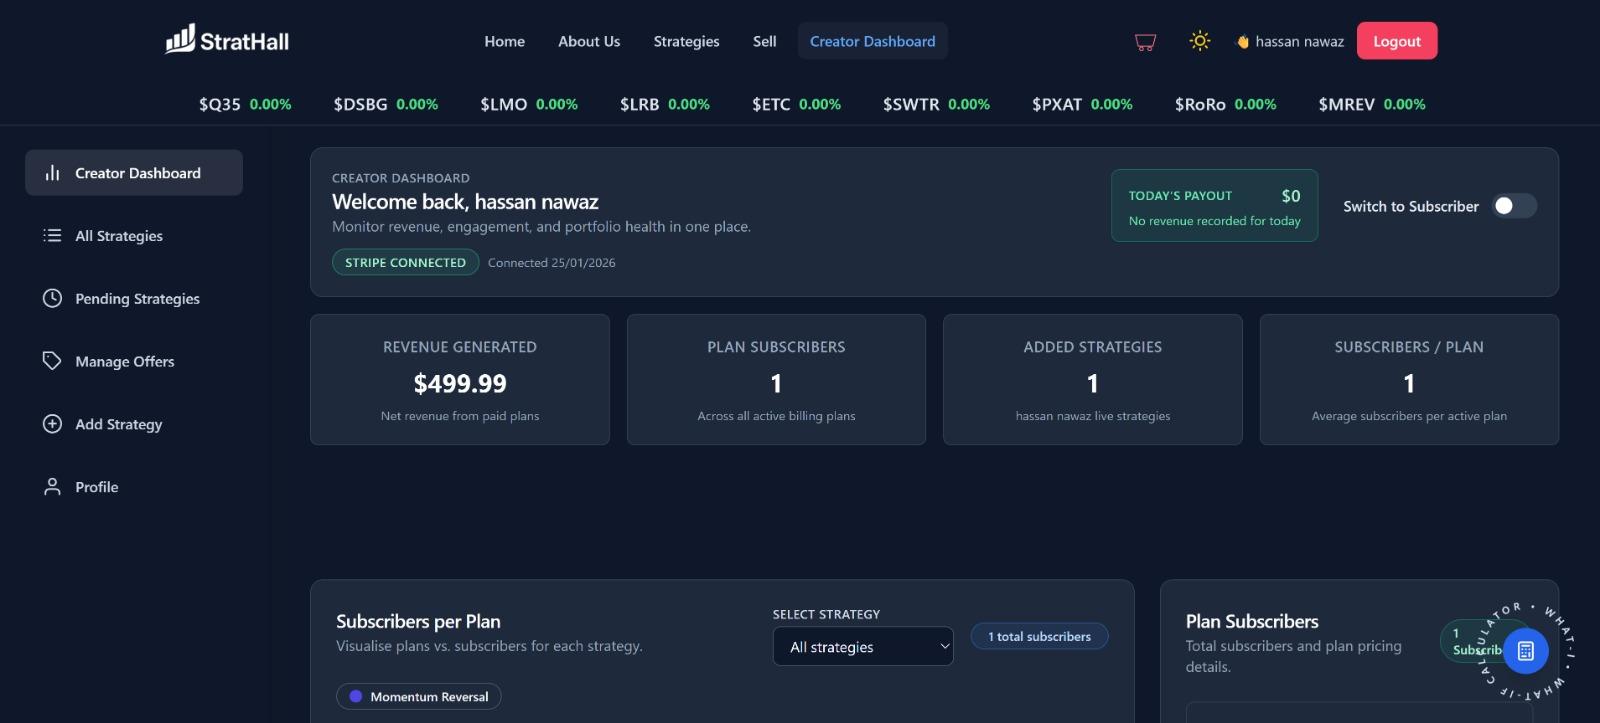
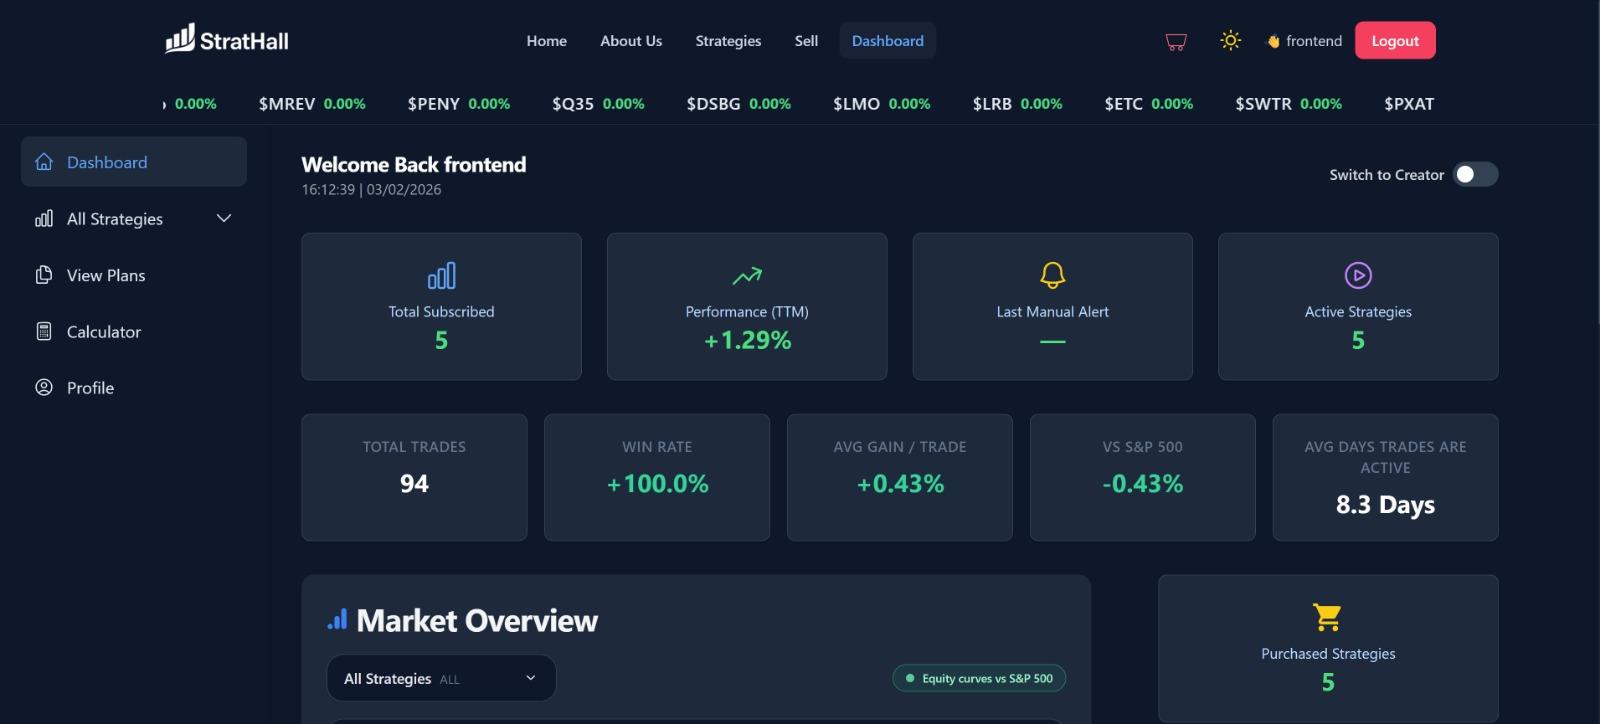
The dark navy-themed homepage featuring live performance highlights and the main value proposition.
Role
Full Stack Developer
Type
Financial Technology Web Application
Focus
Interactive Data Visualization / Financial Calculators
Overview
Project details and contribution.
StratHall is a production-ready fintech web application designed to replace hype-driven financial newsletters with transparent, rule-based strategy tracking. The platform includes a dark navy public landing page, authenticated dashboards, performance analytics, strategy cards, historical trade logs, and an interactive What-If calculator for investment simulations.
Built a responsive financial SaaS interface using Next.js, React, and Tailwind CSS.
Designed a dark navy-themed landing page with performance highlights and a clear fintech value proposition.
Developed authenticated dashboard screens for strategy browsing, portfolio overview, and trade history review.
Implemented interactive performance charts using Recharts to compare strategy returns against the S&P 500.
Created a What-If backtesting calculator that updates projected portfolio values based on investment amount and date inputs.
Designed subscription-focused user flows including trial onboarding and Stripe-backed plan structure.
Structured the project with reusable components such as Navbar, Footer, StrategyCard, dashboard sections, and calculator modules.
Deployed the frontend on Vercel and connected the live domain through Namecheap.
Core Capabilities
Key features built.
Important product features and user-facing capabilities developed for this project.
Rule-Based Transparency
Built a marketplace layout that displays exact entry, exit, and trailing-stop rules for every strategy.
Live S&P 500 Benchmarking
Developed a visual performance layout to compare strategy results directly against market index movement.
Interactive Backtesting
Created a What-If calculator that updates portfolio projections instantly based on capital and date inputs.
Subscription Workflow
Designed a simple onboarding flow for browsing strategies, trial access, and subscription-based usage.
Clean Component Architecture
Separated visual components, dashboard sections, strategy cards, and data logic for better maintainability.
System Design
Technology stack and architecture.
A closer look at how the frontend, data layer, components, and technical structure were planned.
Frontend & UI Layer
- Next.js 14 and React 18 were used for fast rendering, reusable components, and a smooth user experience.
- Tailwind CSS powered the responsive dark navy interface with clean layouts and consistent spacing.
- Recharts was used to build interactive strategy comparison charts and financial performance visuals.
- JavaScript JSX was used for modular component development and dynamic state handling.
Backend & Data Layer
- Next.js API routing was prepared to support server-side requests and future live API integrations.
- A mock data engine was structured to simulate P&L calculations, multi-timeline metrics, and user portfolio views.
Value & Purpose
System outcomes.
The practical value this project provides from a product, user, and technical perspective.
Outcome 01
Clearer Decision Making
The platform gives users a more transparent way to understand trading strategy performance.
Outcome 02
Historical Value Testing
Users can simulate previous investment scenarios before making real financial decisions.
Outcome 03
Scalable Product Base
The structure is ready for future database, brokerage API, and payment gateway integration.
Deep Dive
Engineering challenges and solutions.
A practical look at technical problems faced during development and how they were solved.
Simulating multi-timeline financial data and keeping performance metrics synchronized across multiple pages without a live database.
Created a centralized mock data structure that allowed the UI to simulate P&L values, cumulative returns, and dashboard metrics consistently.
Ensuring complex charts remained readable on smaller screens without clipping or breaking the layout.
Used responsive chart containers and Tailwind CSS layouts to make charts adjust smoothly across desktop, tablet, and mobile views.
Building the What-If calculator so investment values updated instantly when users changed date or amount fields.
Used efficient React state handling and calculation logic to update projected values without slowing down the interface.
Technologies Used
Stack used in this project.
Tools, frameworks, services, and technologies used to build and deploy this project.